Time:2024-01-13 Click:279
Buyer exhaustion and increased selling pressure could lead BTC to $40,500.
A breakdown below the 50 EMA may accelerate the dump below $40,000.
If buyers rebound the price to $45,000, then BTC might rally to $52,000 later.
Bitcoin’s (BTC) plunge in the last 24 hours might not be the end of its correction phase, analyst Ali Martinez noted in a post on January 12. According to Martinez, the weekly chart kept getting “uglier” and this trend has presented another BTC sell signal.
The analyst used the Tom DeMark (TD) Sequential to back up his point. For context, the indicator identifies a turning point in a price trend. It can also be used to detect when exhaustion with a particular movement.
Chaos Before Relief
From the chart shared by Martinez, buyers had become exhausted while noting that BTC could fall as low as $40,500. He, however, revealed that the correction could be the stepping stone that leads Bitcoin above $52,000 later.
This weekly #Bitcoin candlestick is looking uglier by the minute! Remember, the TD presents a sell signal anticipating a one to four weekly candlesticks correction before $BTC resumes the uptrend. https://t.co/fOtoU4JQCZ pic.twitter.com/ZdjpE2PJbr
— Ali (@ali_charts) January 12, 2024
If that happens, it means that the coin price could plummet by another 5.8%. Bitcoin’s price at press time was $43,133, data from CoinMarketCap showed.
This value was in total contrast to what happened on January 11 when the Bitcoin ETFs started trading live. During that time, the BTC price went up to $49,000.
BTC 7-Day Price Performance (Source: CoinMarketCap)
However, the launch of the ETFs quickly became a “sell the news” event as BTC nosedived between January 11 and 12. Also, the price fell to $41,900 on the 12th before its recent recovery.
Is BTC Going to $40,000?
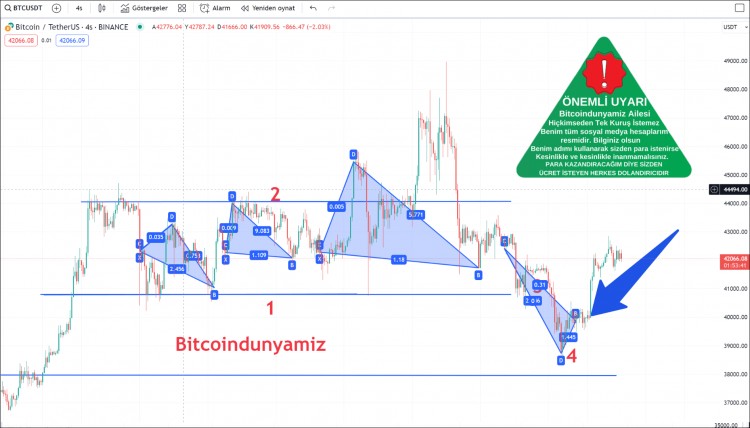
On the 4-hour chart, it was obvious that Bitcoin has been volatile since January 10. However, the price fall from $46,124 to $41,731 was a sign that sellers had halted the initial dominance of buyers.
Indications from the Exponential Moving Average (EMA) showed that the correction may persist. At press time, the 20 EMA (blue) was $45,060 while the 50 EMA (yellow) was $45,061.
Since BTC had broken below the 20 and 50 EMA, it means selling might accelerate. As a result, the BTC price could plunge as low as $40,000. However, there is a chance that bulls might try to stop the decline.
BTC/USD 4-Hour Chart (Source: TradingView)
If the price can rebound back to $45,000, then BTC might retest 49,000 or even trend higher to $52,000. But that possibility seems unlikely in the coming days as selling pressure remains high.
Despite the decline, capital inflows into Bitcoin could change the state of the market. Should this happen, the coin may successfully lead the way for another bullish ride. However, the technical outlook showed that BTC was not done with its correction before its next major uptrend.
The post Bitcoin (BTC) Is Likely to Fall Below $42,000, Here’s Why appeared first on Coin Edition.
ŞimdidahailginçbirnoktayageleceğimBuuyarımektubundaise,konumuzunkriptoparalarvedijitalparalarolmadığı,acilenTeksasolayla...
LamemecoinWIFesuna索拉纳的红色,与其他流行的memecoin进行比较的新的Podríamosdecir,dadoqueselanzóen11月1日pasado。图像3ElsábadopasadofuelanzadolaCa...

BitcoinETFSparksSurge!CryptoRollercoaster:Targets$39KAmidstAnticipation!Postthemuch-hyped#BITCOINETFnews,BTCcontinuesits...

深潮 TechFlow 消息,DeFi 协议 Sky(原 MakerDAO)发布关于从 SparkLend 移除 WBTC-A、WBTC-B、WBTC-C 和 WBTC 的第二份通知。根据 Block Analitica 概述的计划,WBT...